Reporting of Viral Hepatitis Disesase
Reported cases of hepatitis have been classified into hepatitis A, hepatitis B, non-A non-B hepatitis and unclassified (data on hepatitis markers inconclusive) forms since 1988. The criteria of the classification are listed in table 1. This reporting system has documented the incidence of clinical viral hepatitis. The majority were acute hepatitis while a proportion might be acute-on-chronic diseases.
| Classification | Criteria |
| Hepatitis A | IgM anti-HAV positive |
| Hepatitis B | IgM anti-HBc positive |
| NANB | negative for either of the above two |
| Unclassified | data on hepatitis markers inconclusive |
table 1 - classification criteria for the notification of viral hepatitis
The reported incidence of viral hepatitis against time is shown in figure 1 and table 2. It shows that the incidence of hepatitis A essentially dominates that of hepatitis as a whole, accounting for over half of all reported cases each year.
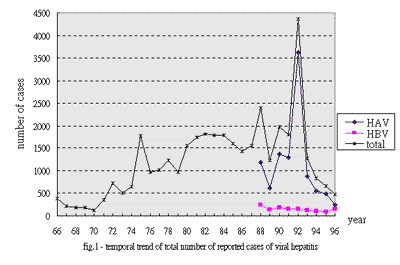
The overall incidence of viral hepatitis was low from 1966 to 1970. A trough occurred in 1970 with a total incidence of only 117. It then gradually increased to 1554 in the year 1980 with two epidemics, in 1972 (729 cases ) and 1975 (1761 cases). A plateau was reached that lasted from 1981 to 1984. A general declining trend was then noted from 1984 to 1995, punctuated by two outbreaks in 1988 (2398 cases) and in 1992 (4357 cases).
| year | A | B | NANB | Unclassified | total |
| 66 | voluntary reporting since 1966 | 386 | |||
| 67 | 218 | ||||
| 68 | 191 | ||||
| 69 | 188 | ||||
| 70 | 117 | ||||
| 71 | 357 | ||||
| 72 | 729 | ||||
| 73 | 509 | ||||
| 74 | notifiable since 1974 | 639 | |||
| 75 | 1761 | ||||
| 76 | 969 | ||||
| 77 | 1008 | ||||
| 78 | 1230 | ||||
| 79 | 964 | ||||
| 80 | 1554 | ||||
| 81 | 1738 | ||||
| 82 | 1814 | ||||
| 83 | 1783 | ||||
| 84 | 1780 | ||||
| 85 | 1601 | ||||
| 86 | 1425 | ||||
| 87 | 1554 | ||||
| 88 | 1187 | 250 | 465 | 496 | 2398 |
| 89 | 618 | 136 | 154 | 324 | 1232 |
| 90 | 1362 | 178 | 183 | 261 | 1984 |
| 91 | 1297 | 150 | 200 | 154 | 1801 |
| 92 | 3626 | 157 | 301 | 273 | 4375 |
| 93 | 874 | 116 | 203 | 80 | 1273 |
| 94 | 557 | 112 | 125 | 41 | 835 |
| 95 | 489 | 99 | 51 | 27 | 666 |
| 96 | 253 | 153 | 44 | 18 | 479 |
table 2 - reported viral hepatitis from 1966 to 1995
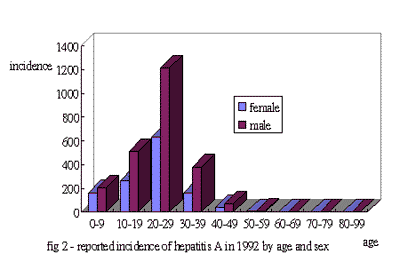
In the 1992 outbreak of hepatitis A. 3626 cases were reported. A breakdown of age and sex is summarized in figure 2. Clinical cases of hepatitis A occurred predominantly in the age group 20-29 (n=1842, 50.8%). The next age group with high incidence was 10-19 (n=770, 21.2%). Hepatitis A was uncommon in age over 50 (n=15, 0.4%).
| age group | female | male | total |
| 0-9 | 160 | 203 | 363 |
| 10-19 | 262 | 508 | 770 |
| 20-29 | 627 | 1215 | 1842 |
| 30-39 | 161 | 375 | 536 |
| 40-49 | 35 | 65 | 100 |
| 50-59 | 4 | 8 | 12 |
| 60-69 | 0 | 1 | 1 |
| 70-79 | 0 | 1 | 1 |
| 80-99 | 1 | 0 | 1 |
| total | 1250 | 2376 | 3626 |