Seroepidemiology of Hepatitis B and D
The seroepidemiologic trend of HBV infection was studied by analyzing data gathered from various sources, including those on the general public as well as people at higher risk of infection.
HBV markers in local Chinese
In a study conducted by Yeoh et al6 in 1978-1979, 16,334 subjects were tested for markers of HBV. The study population comprised 15,660 blood donors of Chinese descent between the ages of 16-40, 329 patients over the age of 41, and 345 patients between the ages of 1-15, hospitalized for non-hepatic diseases. The findings are summarized in tables 7 and 8.
| age group | male | female | total | |||
| no. tested | %+ve | no. tested | %+ve | no. tested | %+ve | |
| 1-5 | 82 | 3.7 | 40 | 2.5 | 122 | 3.3 |
| 6-10 | 76 | 5.3 | 41 | 0 | 117 | 3.4 |
| 11-15 | 55 | 9.1 | 51 | 9.8 | 106 | 9.4 |
| 16-20 | 4833 | 9.2 | 2770 | 6.2 | 7603 | 8.1 |
| 21-30 | 5485 | 12.8 | 1572 | 6.4 | 7057 | 11.4 |
| 31-40 | 874 | 10.8 | 126 | 2.4 | 1000 | 9.7 |
| 41-50 | 225 | 10.2 | 35 | 5.7 | 260 | 9.6 |
| >50 | 52 | 7.7 | 17 | 11.8 | 69 | 8.7 |
| total | 11682 | 11.0 | 4652 | 6.1 | 16334 | 9.6 |
table 7 - prevalence of HBsAg in Chinese population in 1978-1979
The overall prevalence of HBsAg was 9.6%. A significantly higher prevalence of 11.0% was noted in males compared to the 6.1% in females (p<0.01).
| age group | no. tested | %+ve | no. tested |
| 1-5 | 10.4 | 16.8 | 13.6 |
| 6-10 | 18.4 | 5.6 | 13.7 |
| 11-15 | 49.1 | 29.0 | 37.7 |
| 16-20 | 13.8 | 26.2 | 35.6 |
| 21-30 | 47.3 | 40.8 | 45.8 |
| 31-40 | 62.6 | 29.7 | 54.5 |
| 41-50 | 64.7 | 65.7 | 65.4 |
| >50 | 73.7 | 86.8 | 77.5 |
| total | 49.3 | 33.3 | 42.9 |
table 8- prevalence of hepatitis B infection (either HBsAg or anti-HBs positive) in the Chinese population 1978-79
The overall prevalence of hepatitis B infection, defined as the rate of positive results in either HBsAg or anti-HBs in the population In Hong Kong was 42.9% in 1978-79 (table 7).
New Blood Donors
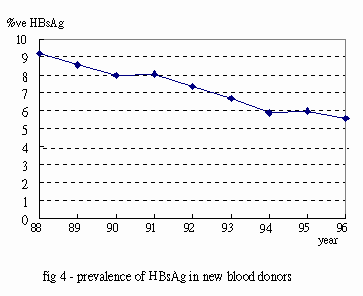
From the data provided by the Hong Kong Red Cross Blood Transfusion Service (HKRCBTS), the prevalence of HBsAg in new blood donors has decreased from 9.2% in 1988 to 5.57% in 1996 (figure 4). The total number of new blood donors varied between 35,000 to 45,000 per year.
| year | HBsAg+ve (%) |
| 88 | 9.2 |
| 89 | 8.57 |
| 90 | 7.97 |
| 91 | 8.04 |
| 92 | 7.38 |
| 93 | 6.7 |
| 94 | 5.88 |
| 95 | 5.99 |
| 96 | 5.57 |
Antenatal women
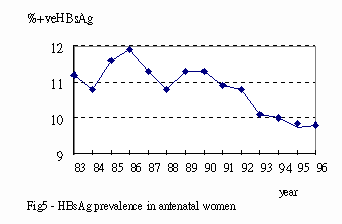
Blood samples have been taken from antenatal women for HBsAg testing since 1983. The prevalence of HBsAg has decreased from >11% in 1983-1987 to 9.7% in 1996 (figures 5 and 6).
| year | no. tested | no. (%) +veHBsAg |
| 83 | 11216 | 1260 (11.2) |
| 84 | 15892 | 1721 (10.8) |
| 85 | 22311 | 2589 (11.6) |
| 86 | 37923 | 4511 (11.9) |
| 87 | 37444 | 4248 (11.3) |
| 88 | 39883 | 4303 (10.8) |
| 89 | 34293 | 3880 (11.3) |
| 90 | 31749 | 3574 (11.3) |
| 91 | 30075 | 3278 (10.9) |
| 92 | 31394 | 3391 (10.8) |
| 93 | 34221 | 3456 (10.1) |
| 94 | 32470 | 3247 (10.0) |
| 95 | 30962 | 3016 (9.74) |
| 96 | 31508 | 3072 (9.7) |
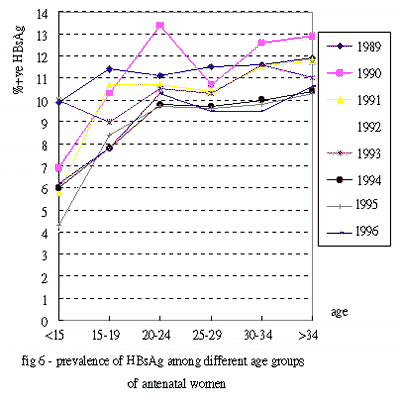
| no. tested (% positive HBsAg) according to age group | ||||||
| year | <15 | 15-19 | 20-24 | 25-29 | 30-34 | >34 |
| 1989 | 304(9.9) | 976(11.4) | 4622(11.1) | 12419(11.5) | 7591(11.6) | 2548(11.9) |
| 1990 | 447(6.9) | 1044(10.3) | 4671(13.4) | 15228(10.7) | 7639(12.6) | 2780(12.9 |
| 1991 | 86(5.8) | 987(10.7) | 4620(10.7) | 13151(10.4) | 8168(11.5) | 3063(11.8) |
| 1992 | 50(4.0) | 928(9.6) | 5065(11.4) | 13093(10.6) | 8788(10.6) | 3470(11.7) |
| 1993 | 30(10.0) | 984(9.0) | 5589(10.5) | 12345(10.3) | 9395(11.6) | 3798(11.0) |
| 1994 | 50(6.0) | 951(7.8) | 5723(9.8) | 11590(9.7) | 10158(10.6) | 3998(10.4) |
| 1995 | 474(4.3) | 922(8.4) | 4979(9.7) | 10619(9.6) | 10112(9.8) | 4283(10.3) |
| 1996 | 97(6.2) | 842(7.8) | 4765(10.3) | 10137(9.5) | 9759(9.5) | 5908(10.6) |
table 9 - prevalence of HBsAg among antenatal women by year and age
When compared with clients of the Premarital Package Service (section 5.4), a relatively high rate of HBsAg carriage is evident. This phenomenon may be explained by a recent study of Kwan et al7 , which found that a significant proportion (39.7%) of the antenatal population in Hong Kong were Mainland Chinese with a different carrier rate of HBsAg. Whereas the Mainland Chinese had a carrier rate of 13.1%, local Chinese had a lower rate of 8.4% (p<0.001). The overall rate of 10% is mainly the weighted mean of the 2 population groups (table 10)
| ratio (%) +ve HBsAg | |||
| age | Hong Kong | China | all |
| 15-19 | 0/33 (0) | 0/9 (0) | 2/47 (4.3) |
| 20-24 | 12/156 (7.7) | 23/132 (17.4) | 38/373 (10.2) |
| 25-29 | 35/436 (8.0) | 52/379 (13.7) | 91/910 (10.0) |
| 30-34 | 44/460 (9.6) | 36/331 (10.9) | 85/851 (10.0) |
| >35 | 11/135 (8.1) | 18/134 (13.4) | 31/299 (10.4) |
| total | 102/1220 (8.4) | 129/985 (13.1) | 247/2480 (10.0) |
table 10 - HBsAg prevalence of Hong Kong and Mainland Chinese antenatal women by age group
Premarital screening
Data derived from clients who attended the Premarital Package Service (PMPS) of the Family Planning Association of Hong Kong showed that the prevalence of HBsAg has decreased from 10.2% in 1988 to 7.9% in 1996 (table 11).
| HBsAg+ve | |||
| year | total no. of cases | no. | % |
| 1988 | 19,580 | 1,988 | 10.2 |
| 1989 | 17,624 | 1,710 | 9.7 |
| 1990 | 17,251 | 1,659 | 9.6 |
| 1991 | 19,142 | 1,831 | 9.6 |
| 1992 | 18,445 | 1,708 | 9.3 |
| 1993 | 19,193 | 1,661 | 8.7 |
| 1994 | 16,466 | 1,210 | 7.3 |
| 1995 | 16,798 | 1,320 | 7.9 |
| 1996 | 19,959 | 1,575 | 7.9 |
table 11 - HBsAg prevalence of clients who attended the premarital package service
University students
A hepatitis B vaccination campaign8 organized for students of the University of Hong Kong in 1992 showed that the HBsAg rate was 4.45% in 1450 male students and 2.97% in 2119 female students (age range 19-25). Anti-HBs was positive in 11.79% of male students and 11.75% of female students.
Intravenous drug user (IVDU)
Serum samples received from drug rehabilitation centres and correctional institiutions were routinely tested for HBsAg. Those negative for HBsAg were tested for anti-HBs, and those negative for both HBsAg and anti-HBs were then tested for anti-HBc. Table 12 and figure 7 summarize the results. Please note that samples taken from 1985 to 1992 were mainly from correctional institutions whereas from 1993 to 1996 mainly methadone clinics.
| % +ve | |||||
| year | no. tested | HBsAg | anti-HBs | anti-HBc | HBV markers |
| 1985 | 476 | 16.8 | 57.9 | 19.7 | 94.4 |
| 1986 | 540 | 14.6 | 55.2 | 21.3 | 91.1 |
| 1987 | 513 | 12.7 | 56.0 | 21.6 | 90.5 |
| 1988 | 1333 | 13.5 | 54.4 | 21.2 | 89.1 |
| 1989 | 668 | 13.3 | 59.0 | 18.9 | 91.2 |
| 1990 | 1067 | 13.4 | 59.0 | 15.7 | 90.8 |
| 1991 | 1517 | 14.4 | 54.4 | 20.5 | 89.3 |
| 1992 | 827 | 14.0 | 49.3 | 21.5 | 84.9 |
| 1993 | 749 | 14.3 | 43.1 | 12.3 | 69.7 |
| 1994 | 616 | 12.7 | 37.5 | 13.0 | 63.1 |
| 1995 | 190 | 10.5 | 36.8 | 11.6 | 58.9 |
| 1996 | 363 | 8.8 | 42.4 | 12.9 | 62.3 |
table 12 - prevalence of HBV markers among IVDU from 1985-1996
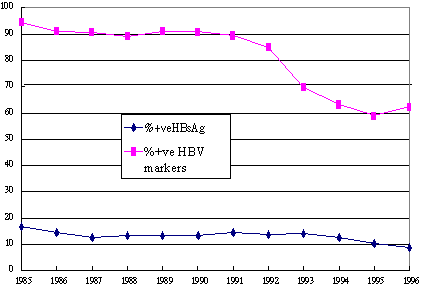
fig 7 - trend of HBV markers among IVDU
The ratios of both HBsAg and HBV markers have decreased. The HBV carrier rate has decreased from 16.8% in 1985 to 8.8% in 1996. The HBV markers rate decreased from 94.4% in 1985 to 62.3% in 1996.
A study by Lim et al9 showed that the prevalence of HBV markers among IVDUs had decreased from 92.7% (n=1017) in 1985-86 to 78.9% (n=1145) in 1992-93 (p<0.0001). There was a decline of HBV prevalence from 90% in 1985-86 to 73.9% in 1992-93 among those IVDU with ¡Ø5 years of drug use (p<0.0001). A decline in infection rate from 97.4 to 88.8% was noted in those who had reportedly injected for >5 years (p<0.0001) (table 13)
| HBV marker | ||||
| 1985-86 | 1992-93 | |||
| age | no. tested | %+ve | no. tested | %+ve |
| duration of abuse <=5yr | ||||
| 10-19 | 13 | 84.6 | 85 | 52.9 |
| 20-29 | 379 | 86.8 | 262 | 73.7 |
| 30-39 | 181 | 95.6 | 123 | 85.4 |
| >40 | 46 | 95.7 | 39 | 87.2 |
| NS | 4 | 75 | 42 | 71.4 |
| total | 619 | 90 | 551 | 73.9 |
| duration of abuse > 5yr | ||||
| 10-19 | 1 | 100 | 0 | 0 |
| 20-29 | 78 | 98.7 | 122 | 86.9 |
| 30-39 | 216 | 97.2 | 192 | 92.2 |
| >40 | 5 | 96.8 | 133 | 85.7 |
| NS | 0 | 0 | 15 | 86.7 |
| totals | 390 | 97.4 | 447 | 88.8 |
Table 13 - prevalence of HBV infection among intravenous drug users
Data from the same study9 showed that the prevalence of HDV has decreased from 63.1% of 149 HBsAg carriers in 1985-86 to 28.8% of 153 HBsAg carriers in 1992-93 (p<0.0001). There was a greater decline in infection rate in those with ¡Ø5 years of drug use (p<0.0001) when compared with those having used drugs for over 5 years (p<0.01) (table 14).
| anti-HDV | ||||
| ¡@ | 1985-86 | 1992-93 | ||
| age | no. tested | %+ve | no. tested | %+ve |
| duration of abuse <=5yr | ¡@ | |||
| 10-19 | 2 | 0 | 8 | 0 |
| 20-29 | 54 | 50 | 40 | 12.5 |
| 30-39 | 31 | 48.4 | 20 | 20 |
| >40 | 5 | 80 | 3 | 66.7 |
| NS | 0 | 0 | 4 | 0 |
| total | 92 | 50 | 75 | 14.7 |
| duration of abuse > 5yr | ¡@ | ¡@ | ¡@ | |
| 10-19 | 0 | 0 | 0 | 0 |
| 20-29 | 11 | 54.5 | 14 | 64.3 |
| 30-39 | 13 | 97.8 | 22 | 59.1 |
| >40 | 11 | 100 | 14 | 35.7 |
| NS | 0 | 0 | 2 | 50 |
| totals | 55 | 83.6 | 52 | 53.8 |
table 14 - HDV prevalence among IVDU
Police officers
An ongoing vaccination campaign undertaken by the Department of Health and the Royal Hong Kong Police effectively allows screening of police officers for Hepatitis B markers. What data that are available now indicate a relatively low level of carriage. Out of the 3134 police officers that were screened, 6.2% were positive for HBsAg. On subgroup analysis, the prevalence of Hepatitis B carriers among female officers is especially low at only 3.5%. Breakdown of the data is as follows:
| male | female | |||||
| age | no. tested | no.(%) +ve for Hep B markers | no.(%) HBsAg+ve | no. tested | no.(%) +ve for Hep B markers | no.(%) HBsAg+ve |
| <20 | 1 | 0(0) | 0(0) | 0 | 0(0) | 0(0) |
| 20-30 | 616 | 178(29.1) | 28(4.5) | 249 | 72(28.9) | 8(3.2) |
| 31-40 | 1300 | 980(75.4) | 89(6.8) | 137 | 49((35.8) | 4(2.9) |
| 41-50 | 669 | 398(59.5) | 51(7.6) | 93 | 37(39.8) | 5(5.4) |
| 51-60 | 67 | 39(58.2) | 9(13.4) | 2 | 1(50) | 0(0) |
| total | 2653 | 1595(60.1) | 177(6.7) | 481 | 159(33.1) | 17(3.5) |
table 15 - prevalence of HBV among police officers by sex and age
Children and young adults
Blood samples from children submitted to the Virus Unit for virology examination were tested for HBsAg and anti-HBs in 1990 and 1993. It was found that the prevalence of HBsAg had decreased in all age groups (Table 16).
For the testing in 1993, the prevalence of anti-HBs has decreased from 91.5% in children of age 1 to <2 years to 69.2% in children of age 4 to <5. This might be due to the fall of anti-HBs level after vaccination. Missed vaccination may also have contributed to the difference. Hepatitis B vaccination has been offered to all newborn since late 1988.
| no. tested | %+ve for HBsAg | %+ve for anti-HBs | ||||
| age (yr) | 1990 | 1993 | 1990 | 1993 | 1990 | 1993 |
| 1-<2 | 100 | 47 | 0 | 0 | 71 | 91.5 |
| 2-<3 | 98 | 38 | 2.0 | 0 | 39 | 89.5 |
| 3-<4 | 96 | 36 | 6.3 | 2.8 | 10.1 | 80.6 |
| 4-<5 | 98 | 26 | 0 | 0 | 16.7 | 69.2 |
| 5-9 | 97 | 123 | 7.2 | 2.4 | 12.9 | 50.4 |
table 16 - prevalence of HBV markers among children
A study being conducted by Albert Lee5 of the Chinese University also examined the prevalence of HBV in adolescents (aged 11-20). Preliminary data indicate the prevalence of HBsAg is 5.8% and that of HBV markers 17.0%. These results are in line with those released recently by the Cancer Crusade Angels Service Society of Hong Kong who in the last two years also conducted screening of students of secondary schools and vocational training institutes. In their studies, the overall carrier rate of HBsAg was found to be 6.5% and 5.8% in 95 and 96 respectively. Breakdown according to age and sex is as follows (tables 17 and 18).
| male | female | |||||
| Age | no. | anti-HBs+ve(%) | HBsAg +ve (%) | no. | anti-HBs+ve(%) | HBsAg +ve (%) |
| 11-15 | 214 | 40 (18.7%) | 22 (10.3%) | 69 | 19 (27.5%) | 3 (4.3%) |
| 16-20 | 610 | 120 (19.7%) | 54 (8.9%) | 495 | 91 (18.4%) | 31 (6.3%) |
| 21-25 | 219 | 27 (12.3%) | 5 (2.3%) | 224 | 40 (17.9%) | 4 (1.8%) |
| total | 1043 | 187 (17.9%) | 81 (7.8%) | 788 | 150 (19.0%) | 38 (4.8%) |
table 17 - prevalence of HBsAg in young adults in 1995
| male | female | |||||
| Age | no. | anti-HBs+ve(%) | HBsAg +ve (%) | no. | anti-HBs+ve(%) | HBsAg +ve (%) |
| 11-15 | 873 | 134 (15.3% | 22 (10.3%) | 878 | 125 (14.2%) | 52 (5.9%) |
| 16-20 | 527 | 94 (17.8%) | 31 (5.9%) | 562 | 108 (19.2%) | 27 (4.8%) |
| 21-25 | 99 | 27 (12.3%) | 6 (6.1%) | 94 | 25 (26.6%)) | 5 (5.3%) |
| total | 1499 | 244 (16.3%) | 91 (6.1%) | 1534 | 258 (16.8%) | 84 (5.5%) |
table 18 - prevalence of HBsAg in young adults in 1996
Female commercial sex workers
626 consecutive female commercial sex workers were screened for markers of hepatitis B when they attended the Yaumatei Social Hygiene Clinic from 1 Mar 95 to 3 Mar 97. 40 (6.4%) were HBsAg+ve, 346 (55.3%) were anti-HBs+ve, and 240 negative for both markers.
Health care workers
In 1983, a total of 3,347 health care workers were screened for HBV markers in a study by Yeoh et al10. The results are as shown in table 19.
| HBsAg | anti-HBs | markers of HBV | |
| pre-entry (n=187) | 7.5% | 20.3% | 30.8% |
| 0-5 yr (n=1781) | 8.9% | 27.4% | 40.8% |
| 5-10 yr (n=666) | 9.3% | 38.4% | 52.5% |
| >10 yr (n=713) | 10.8% | 43.1% | 58.7% |
table 19 - HBV markers among health care workers in 1983
From 1983 to 1991, another 26,188 health care workers were screened for HBV markers prior to vaccination - 6.2% were found to be positive for HBsAg, while 26.4% were positive for anti-HBs.
In an HBV vaccination campaign organized for the staff of the Department of Health in 1995, 719 health care workers were screened for HBV markers - 7.0% were positive for HBsAg and 36.3% positive for anti-HBs.
Among these 719 staff who had undergone blood screening, 689 could be traced for their particulars. 220 were male and 469 female. The age breakdown is as shown in table 20.
| age markers |
no. of staff (%) | |||||
| <21 | 21-30 | 31-40 | 41-50 | 51-60 | total | |
| HBsAg+ve | 0(0) | 5(5.7 | 17(6.7) | 15(6.6) | 10(8.8) | 47(6.8) |
| anti-HBs+ve | 3(42.9) | 28(32.2) | 88(34.9) | 92(40.2) | 40(35.1) | 251(36.4) |
| HBsAg/anti-HBs (-/-) |
4(57.1) | 54(62.1) | 147(58.3) | 122(53.3) | 64(56.1) | 391(56.7) |
| total | 7(100) | 87(100) | 252(100 | 229(100) | 114(100) | 689(100) |
table 20 - Hepatitis B markers in health care workers screened in 1995
In another study by the Department of Health in 1989, results of HBsAg screening in 1,087 ambulance officers are shown in table 21.
| age | no. tested | %+ ve |
| 15-24 | 124 | 3.2 |
| 25-34 | 679 | 11.5 |
| 35-44 | 251 | 12.0 |
| >45 | 33 | 12.1 |
table 21 - HBsAg prevalence among ambulance officers in 1989
Lim et al11 report that among 5825 health care workers who were screened in 1992 and 1993, 255 (4.7%) were positive for HBsAg, 2223 (38.2%) were positive for anti-HBs, and 3347 (57.5%) lacked both HBV markers. A recent vaccination campaign (1995-96) for the staff of the Caritas Medical Centre (CMC) identified 39 carriers of HBsAg among 921 health care workers, an overall prevalence rate of 4.2%
| no. of staff (%) | ||
| markers | male | female |
| HBsAg+ve | 15(11.2) | 243(3.0) |
| anti-HBs+ve | 60(44.8) | 415(52.7) |
| HBsAg/antiHBs (-/-) | 59(44.0) | 348(44.2) |
| total | 134(100) | 787(100) |
prevalence of HBV in staff of CMC
People with HIV/AIDS
Data from the AIDS Unit of the Department of Health indicate a relatively high level of HBsAg carriage among those who have results of HBV markers available. As of Dec 96, the overall rate of HBsAg positivity approached 16%.
| sex | no. +ve HBsAg (%) | no. +ve anti-HBs (%) | total |
| male | 21 (16) | 60 (45.8) | 131 |
| female | 2 (15.3) | 6 (46.1) | 13 |
| total | 23 (15.9) | 66 (45.8) | 144 |
table 22 - prevalence of HBsAg in people with HIV/AIDS
Prevalence of HDV among HBV carriers
From 1985 to 1987, 198 patients with HBV related liver diseases were screened for anti-HDV antibody in a study by Leung et al12, only 1 patient was detected positive.
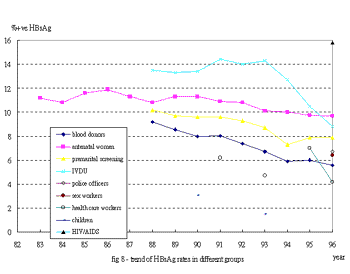
Summary of HBsAg rate among different groups
Figure 8 summarizes the above data on HBV carrier rate among different groups. The HBsAg rates among all the different groups have been falling over time.